Looking back at 2025; pre-CNY demand; ports prepare for Suez return
Team Shypple
December 29, 2025
Welcome back.
Rate expectations
The pre-CNY rush begins
While business slows down for the holidays between Christmas and New Year, the Asia-Europe trade lane is gearing up for a volatile start to 2026. As we look toward January, the traditional "pre-Chinese New Year rush" is officially underway.
Tight space & rising rates Shippers returning to their desks in early January will likely face a tightened market. Space is expected to be limited in the coming weeks as carriers strictly manage capacity allocations. Driven by strong year-end volumes and seasonal demand, spot rates have already climbed for three consecutive weeks. We expect major carriers (including Maersk, CMA CGM, and MSC) are capitalizing on this by implementing new Peak Season Surcharges (PSS) and rate hikes effective immediately in the new year.
Front-loading Beyond the usual seasonal peak (Chinese New Year starts mid-February), poor schedule reliability is prompting many shippers to "front-load" cargo (shipping earlier than usual to avoid potential delays).
Outlook: post-holiday blank sailings Carriers are already looking beyond the peak. To align capacity with the expected demand drop after the holidays, the Gemini Cooperation has already announced blank sailings for late February (weeks 8 and 9). (The Loadstar)
Ports brace for Suez return after first vessels going eastbound
While a full reopening of the Red Sea route remains pending, late 2025 marks a distinct shift: carriers are cautiously returning to the Suez Canal, but for now, almost exclusively in the southbound/eastbound direction (from Europe/US back to Asia).
The logic is primarily operational. Vessels returning to Asia (often empty or with lighter loads) present a lower risk profile compared to fully laden westbound ships. Furthermore, using the Suez Canal for the return leg cuts 7 to 10 days off the transit time compared to the Cape route, helping carriers reset disrupted schedules and improve vessel availability in Asia.
Status by carrier Strategies diverge significantly across the market. While some are leading the charge, others remain hesitant.
CMA CGM
Has led the way by actively reinstating the Suez route (Southbound/Asia-bound) for specific services.
Ocean Alliance (COSCO, OOCL, Evergreen)
Largely following the lead of partner CMA CGM (Southbound/Asia-bound).
Maersk
Conducted a trial in December 2025 by sending a vessel (Maersk Sebarok) through the canal Southbound/Asia-bound.
However, Maersk emphasizes this is a "single-vessel test" and not the start of a full network return. Caution remains their watchword.
Hapag-Lloyd
Remains the most cautious. CEO Rolf Habben Jansen has stated that any return (Southbound/Asia-bound) must be "gradual and orderly." No large-scale routing changes have been confirmed yet.
MSC
Continuing to perform individual vessel tests (Southbound/Asia-bound) but has not yet committed to a full network switch-over.
Premier Alliance
Preparing to resume Red Sea transits, but this can only be possible if the carriers are sure that the Houthis have stopped attacking ships.
European ports brace for impact: what if the flow returns to Northbound?
While the current movement is predominantly towards Asia, European ports are already preparing for the moment the flow turns Northbound (Westbound) via Suez.
The primary concern is "bunching." If carriers collectively decide to switch the shorter route back to Europe, these vessels will arrive simultaneously with ships that are still completing the longer journey around the Cape of Good Hope. This creates a "double wave" of arrivals within a very short window.
Port preparations for Westbound (North) return Ports are actively taking measures to manage the expected peak:
Antwerp-Bruges: Is promoting "night logistics" at terminals and depots to spread the load and is rolling out digital tools (like CPU) to streamline pickups.
Hamburg: Warns that while they are coordinating 24/7, waiting times will likely be "unavoidable" if many carriers switch routes simultaneously.
Rotterdam: Is conducting impact analyses and urging the market to use real-time data platforms (like Portbase) to anticipate arrival peaks.
In 2025, carriers struggled to maintain control. Despite their efforts, structural overcapacity and fierce competition made it impossible to dictate the market direction for long.
Q1 & Q2: the phantom peak. The year saw a sudden spike in rates on the Asia-America trade, driven by shippers rushing cargo to beat US tariffs. However, this peak was artificial. As soon as carriers added capacity to cash in, demand vanished and rates collapsed.
Q3: the price war. By summer, the market fractured. Even though ships on the Asia-Europe trade were physically full, rates dropped sharply. The cause? Intense competition. Carriers fought for market share rather than maintaining price discipline, triggering a price war.
Q4: the artificial floor. To strengthen their hand for the 2026 contract negotiations, carriers aggressively cancelled sailings (blank sailings). This successfully created an artificial price floor for Asia-Europe, although the Transatlantic market remained weak.
Summary: We enter 2026 with rates that are artificially propped up. Carriers have shown they can trigger short-term rallies, but the fundamental problem, too many ships, has not been solved. (The Loadstar)
Price-setters or price-takers? How the carriers played the rate game in 2025
The carrier landscape in 2025 was defined by a sharp strategic split, moving away from a "one size fits all" market.
The aggressor (MSC): Acted as the dominant volume hunter. MSC aggressively injected capacity and prioritized market share over price discipline, accepting high volatility to secure network dominance.
The disciplinarians (Hapag-Lloyd, Maersk, CMA CGM): Functioned as rate engineers. Rather than chasing volume, they focused on margin protection through "shock" rate increases, surcharges, and capacity withdrawals to engineer stability ahead of 2026 contract talks.
The followers (premier alliance): Struggled with operational constraints and tonnage gaps. Consequently, they acted as price takers, reacting to market moves rather than setting them.
Uncertainty was the main theme of 2025. Success didn't come from long-term planning, but from being able to react faster than the competition.
Q1: the tariff rush The year started with high volumes, but appearances were deceiving. This was mostly "front-loading": shippers rushing goods to avoid upcoming US tariffs. Once this urgency faded, it became clear that underlying demand was actually soft.
regulatory shift New rules on "de minimis" (small value) shipments changed the game overnight. Cargo flows to the US dropped, but volumes didn't disappear—they simply moved to Europe and Latin America. It proved once again that freight always finds a new path.
The "missing" peak The traditional holiday peak season never happened. Instead, we saw short, sharp spikes caused by disruptions like weather or specific high-demand goods (like AI chips and Pharma). Meanwhile, general capacity kept growing, which put pressure on profit margins.
Summary: The sector has shown resilience with 28 months of growth. However, the predictable seasonal patterns of the past are gone. We are now in a permanent state of adjustment as global capacity continues to rise. (The Loadstar)
📌 Port congestion
Rotterdam
Average delay ~ 2 days.
Antwerpen
Average delay ~ 2 days.
Germany ports
Hamburg: average delay ~ 5 days.
Bremerhaven: average delay ~ 1 days.
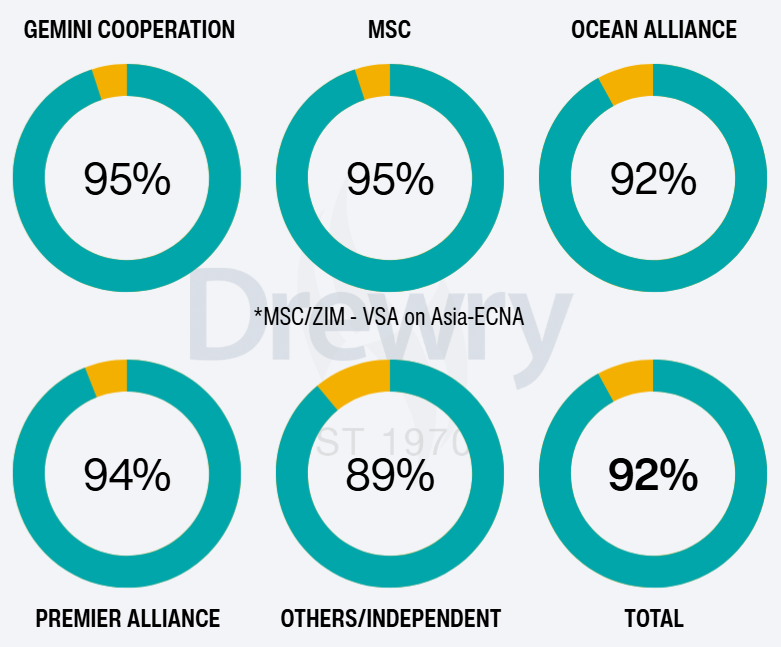
Blank sailings: 8% cancellation rate
Container markets remain soft as carriers continue to trim East-West capacity. From late December to late January, 8% of sailings have been withdrawn (53 of 704).
Most cancellations are concentrated on:
Europe-America (45%, up 14%),
followed by Asia-America routes (38%, down 12%)
and finally Asia-Europe/Med (17%, down 2%).
Yellow represents the percentage of cancelled sailings per carrier alliance. (Drewry)
Ocean & Air
Global
General cargo
Team Shypple
Get market updates delivered
Subscribe to our bi-weekly insights on freight rates, market trends and logistics developments
Thank you! Your submission has been received!
Oops! Something went wrong while submitting the form.